H. L. Plants and W. S. Venable, West Virginia University
Engineering Education, December 1975 page 244
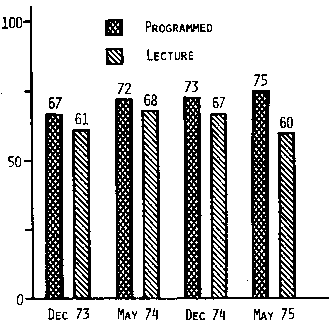
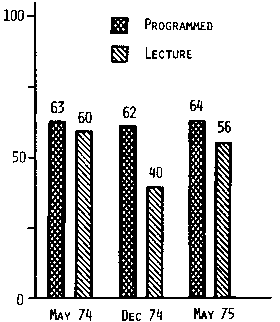
Since the fall semester of 1973 the Department of Mechanical Engineering and Mechanics at West Virginia University has been engaged in a massive study comparing the achievement of students taught using programmed instruction in a specially designed educational system to that of students taught by conventional lecture methods. The study has involved two courses, 12 teachers. 28 classes, and over 800 students. Achievement was measured by performance on common final examinations. The performance of the students using programmed instruction is significantly better than that of students taught by conventional methods (Figures 1 and 2).

The data were collected from two courses, Mechanics I and Mechanics II. The two courses comprise what is referred to as the Mechanics Year and are taken by all engineering students - usually as sophomores. The course content includes statics, dynamics and mechanics of materials, with each course including some elements of all three subject areas.
Both courses had been taught for several semesters before the beginning of the study.
Programmed instruction is not new at West Virginia University. It has been used in parts of sophomore mechanics courses since 1962 and some completely programmed courses have been available since 1967. Several earlier studies (1, 2) involving teaching mechanics with programs have been made at West Virginia University, but none have approached the magnitude and statistical power of the current study. It should be noted, however, that the 11-year local history of programmed instruction prior to the start of this study should be sufficient to dissipate any effects of novelty.
One of the outgrowths of the long use of programmed instruction in the mechanics courses is the development of a carefully planned strategy for its use. (3) Called elastically structured teaching (EST), it is an instructor-paced system allowing a high degree of individualization. This instructional system is used in all programmed sections of mechanics.
Students are assigned to programmed or conventional sections on a quasi-volunteer basis. At registration certain sections arc specified as programmed, and students may enroll in any section that is not filled. Demand for programmed sections has tended to exceed availability, so that many students in programmed sections may be assumed to have chosen them. In recent semesters an attempt has been made to provide both types of instruction at the most popular hours. Overflow sections added after preregistration have been arbitrarily assigned as programmed or conventional for administrative convenience.
During its long history the use of programmed instruction had polarized the mechanics faculty. Programmed instruction had both its supporters and detractors. all convinced that a fair comparison of methods would bear out their contentions. Consequently. almost all faculty were initially quite willing to participate in this study.
The basis of comparison consists of scores on a final examination administered simultaneously to all students enrolled in sophomore mechanics courses. Two examinations are given each term, one in Mechanics I, the other in Mechanics II. The experiment was started one semester sooner in Mechanics I than in Mechanics II.
The first examination was drawn up by a committee of those teaching the course and approved by all course teachers. This was quite cumbersome, however, so that subsequent examinations have been written by faculty not currently teaching the course and are kept secret from the teachers until the beginning of the examination.
In order to assure uniformity in grading, one person is given the responsibility of grading one problem for all students. By using a written grading scale and allowing a very short time for grading - less than 24 hours - a high degree of uniformity in grading has been attained. Grades are obtained by summing the individual problem grades and are based on 100.
To date, approximately 200 students have been tested for each method in each course. This sample size is sufficiently large to make it possible to identify important differences between the methods. The investigators draw added confidence from the fact that both courses give similar results, and that similar results have been obtained each semester. There is still insufficient data to provide firm evidence for conclusions on differences between instructors and differences between class sections, but several interesting trends are becoming apparent in these areas.
Summaries of the statistical analysis of the differences between methods are shown in Figures 1 and 2 and are given in Tables 1 and 2. Each table lists the number of students (n), mean score (x) and standard deviation (s) for each method on each separate trial, as well as the total results from all tests. In addition, values of Student's t, degrees of freedom, and the resultant probability that the results are due to chance are tabulated for each comparison.
| PI | Lect. | ||||||||
| n | x | s | n | x | s | t | df | p | |
| Dec 73 | 55 | 66.85 | (15)* | 112 | 61.31 | (18)* | 2.10 | 165 | .05 |
| May 74 | 22 | 72.64 | 15.39 | 33 | 68.97 | 16.94 | .83 | 53 | n.s. |
| Dec 74 | 107 | 72.84 | 12.82 | 99 | 66.70 | 18.02 | 2.80 | 204 | .01 |
| May 75 | 13 | 75.46 | 13.87 | 43 | 60.19 | 15.95 | 3.36 | 54 | .01 |
| Total | 197 | 71.32 | (13.26)* | 287 | 63.88 | (17.53)* | 5.31 | 482 | .001 |
*estimated
| PI | Lect. | ||||||||
| n | x | s | n | x | s | t | df | p | |
| May 74 | 62 | 62.94 | 16.61 | 92 | 60.03 | 14.57 | 1.12 | 152 | n.s. |
| Dec 74 | 24 | 62.38 | 16.96 | 24 | 40.17 | 20.12 | 4.13 | 46 | .001 |
| May 75 | 86 | 64.21 | 13.46 | 95 | 56.20 | 15.54 | 3.72 | 179 | .001 |
| Total | 172 | 63.49 | 15.09 | 211 | 56.05 | 16.74 | 4.57 | 381 | .001 |
In every case the mean performance of the programmed sections has exceeded that of the lecture sections. On the separate trials, that difference is statistically significant on five of the seven trials. The overall results are significant for both courses.
It is apparent that programmed instruction as administered in the mechanics sequence at West Virginia University results in significantly better performance on the final examination than does conventional instruction. This is a major conclusion in view of the prevalent findings 4 of no significant difference in instructional methods, and warrants further discussion.
The first point to be made is that the test was not merely of programmed instruction but of programmed instruction used in a carefully designed system-elastically structured teaching. It is impossible to say whether the results would hold up if the programs were used in another setting. One piece of evidence points to the conclusion that they might. During the earliest trial several topics in Mechanics I were not programmed. In subsequent trials more topics were programmed, and student scores were improved. In the most recent trials all topics in both courses were programmed, and scores were further improved.
A second important point to be noted is that this study does not involve self-paced instruction. A self-paced option is available at West Virginia University using the programmed materials, but the number of students who have chosen it is small. (All have been successful, but their success is probably inherent in their high ability.) Elastically structured teaching is instructor-paced although quite highly individualized. Consequently, these findings are entirely based on instructor-paced, rather than self-paced, instruction.
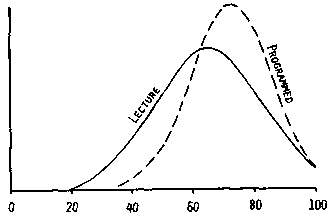
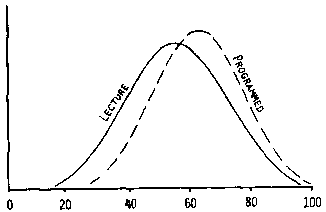
A third point to note is that lectures are not shown to be bad teaching, nor is programmed instruction necessarily good. Individual students from lecture sections have made very high scores and some lecture sections have done as well as some programmed sections. Conversely, some individuals in programmed sections have failed dramatically. Scores for both methods are normally distributed, and while means and variances vary, the extreme range for both methods is from 24 to 100. It is on the average that the programmed sections are significantly better. The score distributions are shown in figures 3 and 4.
A last point to be considered in connection with the major conclusions is that the finals given may not have accurately reflected the objectives of the lecturers. This is quite possible. Since many of their objectives have never been stated behaviorally, it is difficult to measure performance in these areas. The instructors in the programmed sections feel that the examinations provide a reasonable assessment of the problem solving skills and strategies they attempt to teach.
In addition to the major conclusion, several minor inferences may be drawn from an examination of table 3.
| Mech. I | Mech. II | |||||||
| Instructor | Dec 73 | May 74 | Dec 74 | May 75 | May 74 | Dec 74 | May 75 | |
| PI | A | 68.75 | - | 76.54 | - | 65.32 | - | 69.86 |
| A | 65.77 | - | 69.46 | - | 62.33 | - | 64.17 | |
| B | - | - | 75.27 | 75.46 | 60.10 | 62.38 | 63.35 | |
| B | - | - | 69.20 | - | - | - | - | |
| C | - | 72.45 | - | - | - | - | ||
| D | - | - | 70.38 | - | - | - | 60.08 | |
| Lect. | E | 59.18 | 63.80 | - | - | - | - | 59.42 |
| E | - | - | - | - | - | - | 56.69 | |
| F | 58.67 | - | - | 55.44 | 59.30 | - | - | |
| G | 68.16 | 71.20 | - | - | 62.01 | - | - | |
| H | 59.81 | - | 71.50 | 63.60 | - | - | - | |
| H | 57.56 | - | 71.26 | - | - | - | - | |
| I | - | - | 57.39 | - | - | 40.17 | 54.42 | |
| I | - | - | - | - | - | - | 45.00 | |
| J | - | - | 60.75 | - | 58.17 | - | - | |
| K | - | - | - | - | - | - | 63.85 | |
| L | 60.17 | - | - | - | 60.68 | - | - | |
| Overall | Mean | 63.14 | 70.44 | 69.89 | 63.73 | 61.20 | 51.27 | 60.01 |
First, variation among semesters and among sections in a single semester is less with programmed instruction and elastically structured teaching than with conventional instruction. In a service course which is a prerequisite for many others, this sort of quality control may be important. While the lecture sections have means varying from 40 to 60 in Mechanics II and from 58 to 68 in Mechanics I, the programmed sections have varied from 62 to 64 in Mechanics II and from 67 to 75 in Mechanics I, with a variation in the latter from 72 to 75 since all material has been programmed. The number of sections for which data are available is too small to permit a statistical argument at this time.
Second, along the same lines, programmed instruction and elastically structured teaching minimizes differences between teachers. Lecture teachers in Mechanics I have posted class averages ranging from 55 to 68. Teachers using programs in the same courses have ranged from 65 to 76 (69 to 76 in fully programmed courses). Lecturers in Mechanics 11 have produced section averages from 40 to 63. Teachers using programs in the same course have taught sections whose averages ranged from 60 to 65. It should be noted in this connection that both programmed and lecture sections used both veteran and novice instructors. Again, sufficient data are not available to make a conclusive statistical argument.
On the other hand, the fact that the programmed sections do differ from one another raises another interesting point. It implies that there is still room in programmed instruction for the teacher to affect the performance of his class. This is further borne out by the fact that Teacher A has managed to have the top section in Mechanics I or in Mechanics II in four out of four semesters. There is room for personal excellence in teaching programmed instruction as well as in lecturing.
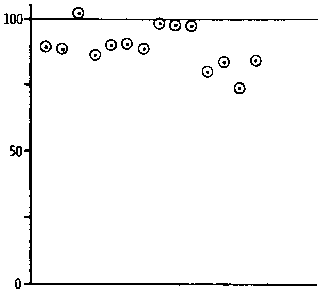
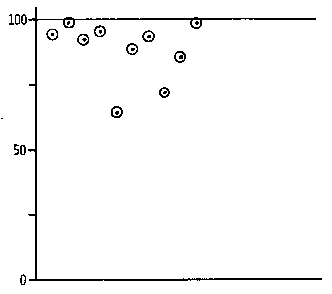
A final observation for which no explanation is offered is that the average performance of the programmed sections has proved to be the upper bound on the performance of individual lecture sections (figures 5 and 6). While individual lecture sections have frequently approached the average performance of the programmed sections, only one has exceeded it.
In summary, analysis of the data taken at West Virginia University in Mechanics I and II supports the conclusion that programmed instruction coupled with elastically structured teaching results in higher and more uniform student achievement than does conventional instruction.