Wallace Venable, Assistant Professor, Mechanical Engineering & Mechanics
John T. Sears, Associate Professor, Chemical Engineering
1976 Frontiers In Education Conference
Engineering Education has traditionally stressed the teaching of analysis, synthesis and evaluation. Not only is a great deal of instructor effort aimed at such goals but students are required to spend large amounts of time in practicing the use of such skills on design projects and similar activities. Hundreds of articles have been published on methods of teaching these "higher skills," yet very little information has been released on how achievement of the related goals and objectives can be measured. This paper describes one attempt at assessing development in this area.
During the past five years the Department of Chemical Engineering at West Virginia has been developing a new pattern of course organization for its undergraduate curriculum. Known as the PRIDE program, 1, 2 this system integrates several courses and projects each year into a single administrative unit. Students enroll in the sophomore, junior, or senior "block" instead of separate courses or sections. A major goal of this revision has been to improve the ability of graduates to analyze engineering problems and to synthesize and evaluate problem solutions.
One facet of the PRIDE program is that students are required to perform design projects at least once (usually twice) each semester during their sophomore, junior and senior years. These projects generally culminate in individual student written reports. It was felt that these reports could furnish the data needed to assess analysis, synthesis and evaluation if a suitable system for scoring reports could be developed.
The scoring system developed is based in part on the "Taxonomy of Objectifies - Cognitive Domain," by Bloom and colleagues, 3 and in part on several systems of recording behavior developed by Amidon and Flanders, 4 and others, for classroom observation.
A score sheet was developed which lists a large number of specific features which reports may include.
A first step in the development of the form involved the transformation of categories in Bloom's Taxonomy from terms descriptive of cognitive behavior into descriptions of items which could be objectively observed in a written report. Thus, "knowledge of specific facts" became "cities specific facts," the inclusion of a graph is accepted as evidence of the ability to translate information from one form to another, and so on.
Seven major categories were established. Bloom's "comprehension" class was split into "summarization" of information and "translation" or transformation of data from one form to another. The seven resulting categories are:
Each category has from three to ten items in the check list. This makes it possible to establish a separate numerical score for each of the categories. There are forty items in all. The full check list is shown in Figure 1.
COLARS Checklist |
- 1 - |
- 2 - |
- 3 - |
- 4 - |
- 5 - |
- 6 - |
- 7 - |
Introduction & Purpose |
|||||||
| Quotes instructions | |||||||
| Restates or summarizes instruction | |||||||
| Classifies Problem | |||||||
| Formulates original experiment/ project | |||||||
Background & Theory |
|||||||
| States scientific laws, principles, etc. | |||||||
| Cites industrial standard, code, practice | |||||||
| Defines standard terms | |||||||
| Summarizes scientific theory | |||||||
| Summarizes industrial practice/ lab method | |||||||
| Checks hypothesis against given information | |||||||
| Distinguishes between relevant/ irrelevant givens | |||||||
| Detects inconsistencies in givens | |||||||
| Shows interactions of elements | |||||||
| Formulates hypothesis | |||||||
Method or Procedure |
|||||||
| Cites procedure in instructions | |||||||
| Performs operations listed in procedure | |||||||
| Identifies/selects standard procedure | |||||||
| Detects defective equipment operations | |||||||
| Produces plan or set of operations | |||||||
| Designs or modifies apparatus/ calculation method | |||||||
| Devises Data classification schemes | |||||||
| Corrects/recommends correction of defective equipment | |||||||
Data |
|||||||
| Tabulates data/design calculations | |||||||
| Graphs data/design calculations | |||||||
| Summarizes trends in data | |||||||
| Detects errors in data/design calculations | |||||||
| Checks data against predictions/ cross checks methods | |||||||
| Develops intermediate data through calculations | |||||||
Analysis & Conclusions |
|||||||
| Cites standard, value or formula for evaluation | |||||||
| Gives verbal summary of tabular or graphic data | |||||||
| Summarizes evidence | |||||||
| Distinguishes facts from hypotheses | |||||||
| Points out assumptions/restrictions | |||||||
| Recognizes errors/inconsistencies in methodology | |||||||
| Draws inductive generalization from specifics | |||||||
| Offers redesign of project/method | |||||||
| Formulates hypotheses for further study/redesign | |||||||
| Evaluates results by comparing with standard | |||||||
| Evaluates two or more results by comparison | |||||||
| Optimizes/evaluates on basis of trends | |||||||
TOTALS |
Figure 1. COLARS Report Evaluation Checklist
As a report is read by an independent observer, the reader doing the scoring simply checks boxes on the score sheet to record those features observed. After the sheet has been filled out, columns are totaled to provide scores on the seven separate categories of behavior.
An assumption was made at the beginning of the development of the score sheet that it should be capable of measuring an increase in student skills over a college career.
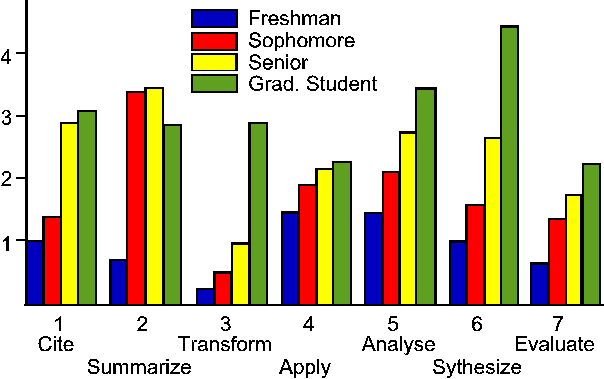
Since the initial development of the COLARS form it has been used to study a sample of reports by freshmen, sophomores, seniors, and graduate students in Chemical Engineering at West Virginia. The average scores for these groups on each category are shown in Table 1 and Figure 2. A positive correlation between group rank and average score is observed for all categories. While the sample is small, the study of the average scores of these groups appears to show that it is, indeed, possible to assess problem solving skills through such a method.
It was recognized that certain types of projects encourage a wider range of behaviors than other assignments, hence a total score would not represent an absolute measure of quality for a single report. A set of scores on a single report may be useful for student guidance, but they are probably not appropriate as grading factors unless considerable background information on the assignment is available.
Figure 2. Average response by student level and category.
Only preliminary attempts have been taken at establishing reliability data on the score sheet. So far, it has been established that interobserver reliability requires detailed instruction of each observer on the interpretation of each item. This short-coming is common in "observation record" methods of assessment. The data reported here were all prepared by a single observer.
Following the development of the scoring system, it was used to compare a collection of reports prepared by seniors in the PRIDE class of 1975 with reports prepared by students who graduated under the previous, more traditional curriculum (Table 2). This comparison seems to confirm the opinions of observers that the curricular changes have in fact improved students' abilities in analysis, synthesis, and evaluation.
| Freshman
|
Sophomore
|
. Senior .
|
Graduate Student |
Maximum Possible |
||
| 1. Citation of facts | Mean | 1.00 |
1.39 |
2.82 |
3.00 |
6 |
| Std.Dev. | .87 |
.61 |
1.19 |
1.22 |
|
|
| 2. Summarization of theories, etc. | Mean | .67 |
3.22 |
3.18 |
2.80 |
4 |
| Std.Dev | .50 |
.94 |
.64 |
.45 |
|
|
| 3. Transformation of data | Mean | .22 |
.44 |
.88 |
2.80 |
4 |
| Std.Dev. | .44 |
.62 |
.86 |
.84 |
|
|
| 4. Application of methods | Mean | 1.44 |
1.83 |
2.12 |
2.20 |
3 |
| Std.Dev. | .53 |
.71 |
.70 |
1.10 |
|
|
| 5. Analysis | Mean | 1.44 |
2.11 |
2.76 |
3.40 |
10 |
| Std.Dev. | .73 |
.96 |
1.03 |
2.07 |
|
|
| 6. Synthesis | Mean | 1.00 |
1.56 |
2.59 |
4.40 |
9 |
| Std.Dev. | .50 |
1.04 |
1.06 |
2.61 |
|
|
| 7. Evaluation | Mean | .67 |
1.33 |
1.53 |
2.20 |
4 |
| Std.Dev. | .71 |
.59 |
.71 |
.84 |
|
|
n |
9 |
18 |
17 |
5 |
|
Table 1. Mean score and standard deviation for students arranged by class
Perhaps more important to the idea of using scoring systems for curricular improvement, this use of COLARS has indicated an area in which student performance appears to have declined. Current students have lower mean scores on citation and summarization documentation skills. With this information at hand, it is possible for the faculty to increase emphasis on these areas and hopefully, regain earlier strengths.
1 |
2 |
3 |
4 |
5 |
6 |
7 |
|
Current (n = 29) |
2.62 |
2.21 |
1.14 |
2.03 |
3.14 |
2.97 |
1.79 |
Past (n= 17) |
2.82 |
3.18 |
0.88 |
2.12 |
2.76 |
2.59 |
1.53 |
Standard Deviation |
1.05 |
1.13 |
0.87 |
.061 |
1.25 |
1.32 |
0.69 |
Table 2. Comparison of mean scores of current seniors (PRIDE) and seniors graduating under the previous curriculum
More work in this area is needed, as this method appears reliable, but this is still unproven. Probably the number of items on the list should be increased in order to facilitate general use. In its current form it remains a rough draft towards a finished instrument.
While we have had only a modest amount of experience with this method of measuring student performance, we feel that our results show that problem solving skills can be measured. COLARS is a first step toward quantitative comparisons of curricula on the basis of skills, rather than knowledge imparted or topics covered.
John T. Sears has been at West Virginia University since 1969, where he is currently Associate Professor of Chemical Engineering and Adjunct Associate Professor of Education. His research interests are solid-gas reactions and education techniques. He is active in AIChE and ASEE Currently he is Vice-Chairman of Publications, ERM Division and Chairman-Elect, North Central Section of ASEE
Wallace Venable is Assistant Professor of Mechanical Engineering and Mechanics and Adjunct Assistant Professor of Education at West Virginia University. He is registered as a Professional Engineer in the State of West Virginia.
Since 1966 he has been involved in the preparation of programmed instruction and in research on various aspects of the effectiveness of instructional systems. He has been associated with WVU's graduate program in Engineering Education since its inception.
He is active in the Educational Research and Methods Division of ASEE having served as Editor of ERM Magazine and as Program Chairman.