Charles E. Wales
West Virginia University
Engineering Education: February 1979
Engineers have never doubted their ability to change the "technical" nature of our society with new machines, construction techniques, electronics, chemicals and systems. Engineering educators, on the other hand, have been much more conservative when faced with change, perhaps justifiably so, because people, not things, are involved. But change is coming to the campus.
Many innovative programs operating today demonstrate that significant educational gains can be made through the use of new "pedagogical systems." One new approach, the Personalized System of Instruction, has demonstrated many gains, 1 including those reported for a PSI physics course taught in the freshman year which led to better grades in subsequent courses in chemistry, biology and in junior year courses in the students' majors (including engineering). 2 This article describes another approach, Guided Design, which was implemented in a new sixcredit freshman engineering program at West Virginia University in 1969. Since that time, the number of students graduating from the college has risen by 32 percent (while data from other engineering colleges show no change) and the graduation grade point average of these students has been 25 percent higher than that of a control group. These are the kinds of gains that should be of interest to all engineering educators.
Among the many factors that surely have contributed to the important educational gains made at WVU are the new Guided Design strategy used in the freshman program, the strong support of both the former and present deans, and changes made by other faculty. Two examples of the latter are the PRIDE program 3 implemented in chemical engineering by Sears, Bailie, Pappano and others, and the work of Plants and Venable to create new patterns in mechanical engineering. 4 Faculty from all departments have made important contributions to the new freshman program both by teaching and motivating students* and by suggesting ways to improve what is done. While data show that important changes have taken place in both the grade point average of the WVU student engineers and the productivity of the college, they do not prove, however, that the freshman program or the teaching efforts of the engineering faculty are responsible; you must examine the data and be the judge of that.
The new WVU freshman program represents one of the four or five courses engineering students take each semester in their first year. It was established by faculty action in 1969 and implemented by Robert Stager, Thomas Long, and Charles Wales. The Guided Design program, is a teachinglearning strategy that:
In the freshman program at WVU, subject matter concepts are presented in a book 8 that emphasizes singleanswer problem solving techniques and helps students make the shift identified by Piaget 9 from concrete to formal operations. Decision making is provided by a second Guided Design text. 10 Five experimental sections of the first course, Freshman Engineering Design (E1) were offered to students in 196970. Beginning in 1970, all entering engineering freshmen were expected to take the E1E2 sequence (three credits each semester).
Examinations are given on a scheduled basis, but in the first course, students are allowed to repeat any quiz or exam as often as necessary within one week. In the second course, students are allowed only one repeat.
Although everyone grumbles from time to time, most engineering
faculty are quite pleased with the quality of students they find
in their classes. Data from several engineering colleges show
that at least by one measure ACT scores (American College Testing
Program)-the "best" high school students select the
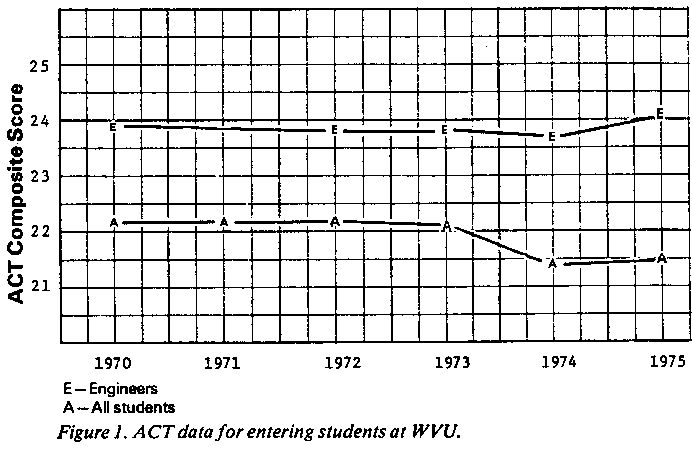
engineering program. Figure 1, which represents average composite
ACT scores for WVU students, is typical of the data for other
engineering colleges: it shows that engineering freshmen (E) have
a consistently higher ACT average than other freshman students
(A) at the University.
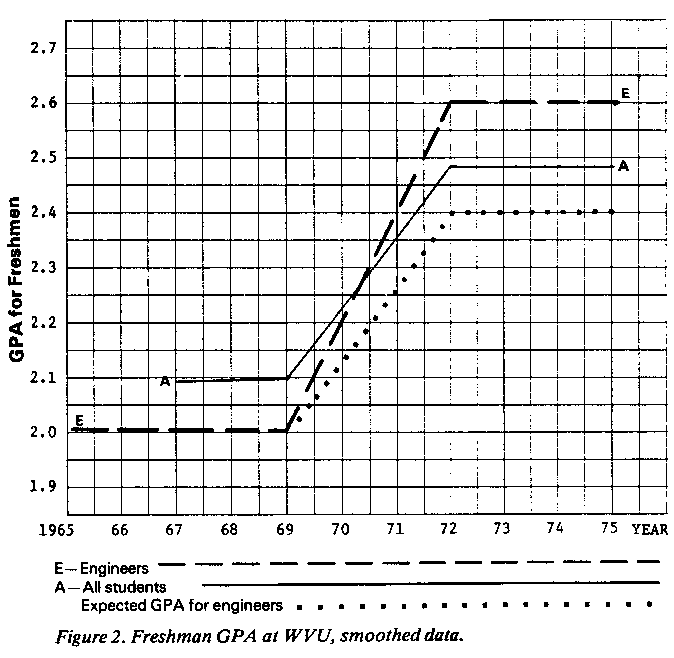
In spite of these high ACT scores, engineering students at any college may have the lowest freshman grade point average (GPA) of any group. This pattern is illustrated by the smoothed GPA curves shown for 1965 to 1969 on the lower left of figure 2. The testing service indicates that this pattern is quite normal, because engineering students usually take more difficult courses in the freshman year.

The GPA curves in the middle of figure 2 show two kinds of changes which occurred at WVU after 1969. One of these changes, an increase in GPA, was apparently due to the grade inflation everyone talks about; this is shown clearly by line A which presents the grade point average for all freshman students at WVU. In this case the GPA increased from about 2.1 in 1969 to 2.48 in 1972. (There appears to be little or no inflation at WVU since 1972.)
A second interesting feature of these data is line E in figure 2, which shows a dramatic shift in the GPA of freshman engineers. The GPA of these students increased from a pre1969 average of 2.01 to a level of 2.6 after 1971, well above that for the other freshmen. Given the pattern that had existed prior to 1969, the best one might have expected would be that the GPA line for freshman engineers would lie parallel to but remain below line A, as shown by the dotted line on figure 2.
Although pleased with this change, faculty were not totally surprised, for two reasons: 1) in 1969 the number of credits required in the freshman year was reduced by three, making the load in the first semester lighter and 2) as the two freshman engineering courses (ElE2) were competencybased, freshman engineers should be expected to earn better grades and thus higher GPAs.* If you assume that this policy allows each engineering freshman to earn a grade that is one level higher than might otherwise be expected in these six credits (e.g., an A instead of a B in both E1 and E2), then you can account for most, but not all, of the difference between the actual engineering PA and what might have been expected. To determine if some factor other than the new freshman program had caused the grade shift, both high school grades and ACT data were checked; neither could account for the change.
The faculty "attitude" which supports the freshman engineering program, and presumably accounts in part for the grade gains, should be noted. It is in sharp contrast to the attitude at some universities, where the first course is designed to screen out supposedly weak students. Some schools believe that the freshman year should be difficult enough to encourage those who are not "qualified" - a third or more of the class to leave as soon as possible. To do otherwise, some would argue, is simply to delay the inevitable time when many will flunk out.
In contrast, there are many faculty who believe their role is to help students get as far as they are able and that many students could complete college if they got a better start. The WVU data appear to support this viewpoint. After the introduction of a supportive freshman program in engineering, not only did more students graduate, but they earned better grades as well.
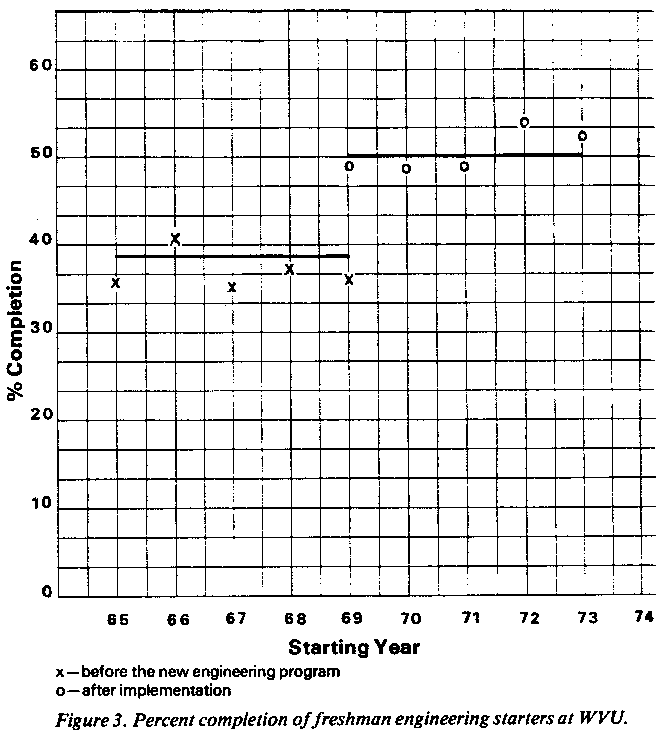
The faculty who teach the freshman courses at West Virginia work very hard to see that each student learns how to use two basic tools: 1) the singleanswer problem solving skills that support almost all other engineering courses and many in science, and 2) the decision making skills required to solve openended problems. Since it could be expected that success with these two goals would have an impact on a student's college career, data for graduates were also examined. They showed an increase, after the new program was introduced, not only in the number of students completing just the freshman year, but the fouryear engineering program as well. As shown in figure 3, about 38 percent of the students who started at WVU as freshman engineers actually graduated from the college during the five years before the new program started. This figure is close to the current average completion rate of about 40 percent reported by several other large engineering schools. During the next five years, however, 50 percent of the students who began finished the engineering program at WVU, a gain of almost 32 percent in the number completing their education in engineering.

Given the improved freshman grades noted earlier, one might expect these results. Better freshman grades should help more students go on to graduation. The freshman year, after all, is generally the critical period in the life of a college student; the dropout rate for sophomores, juniors, and seniors is usually much lower than that of freshmen. On the other hand, if it is possible to design two competencybased courses that help freshmen earn better grades, and if this results in a significant increase in the completion rate, then perhaps educators should seriously consider adopting or designing such courses as a general practice.
One might attempt to explain the completion data by proposing that the dismal job prospects described by the national press in the late 1960s caused a different breed of students to enter engineering. Enrollment in the college did decrease dramatically at WVU from 416 freshmen in 1970 to 200 in 1972. Although those who entered after 1970 might have been different, the difference does not show up in their high school GPA or ACT scores. In addition, our data indicated that a completion rate of over 50 percent persists, while enrollments climb (by 20 percent in 1973, for example, 36 percent increase in 1974). And finally, data from other engineering colleges show equivalent enrollment declines and gains, but no change in the completion rate.
One might also speculate that when classes were smaller, engineering faculty subconsciously responded by giving better grades so that fewer would drop out. GPA data for engineering classes show, however, that during this period the same or lower grades have been given at all levels in these classes (from 3.14 in 1971 to 3.06 in 1975). This factor therefore does not account for the increase in the completion rate.
In 1969 the total number of hours required for graduation from WVU was reduced from 144 to 136; data from other engineering colleges that experienced this kind of change do not, however, show a corresponding increase in completion rate.
Could grade inflation in the other classes engineering students take have affected their completion rate? Data from The Statistical Profile of WVU shows that grade inflation did occur at the University and grades for all students at all levels increased from 2.55 in 1969 to 2.75 in 1971. Since then, however, grades have been relatively steady. If better grades mean that fewer students flunk out, data from other engineering colleges that have experienced grade inflation should show a similar increase. The data we were able to collect does not show a change.
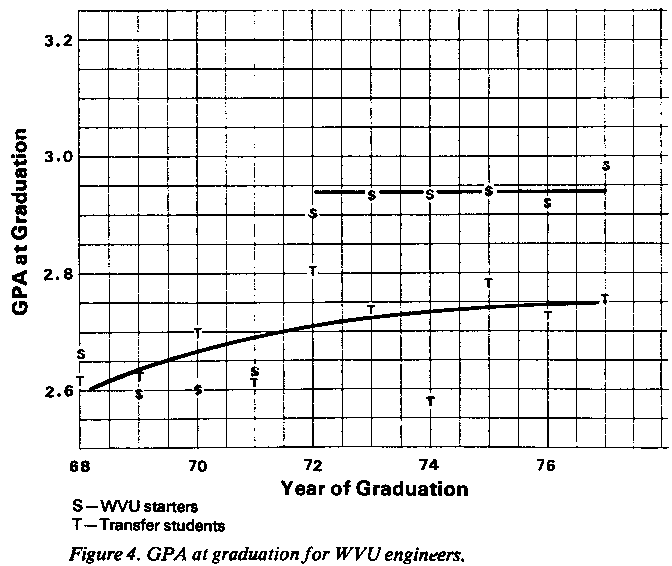
Another major change which took place after the new freshman
program was introduced is shown in figure 4, which presents the
grade point average of graduates from the college. In this
case there is a control group, the 25 percent of the students who
transfer to WVU after taking about onethird of their work
elsewhere. Since, between 1968 and 1972, transfer students and
WVU starters graduated with essentially the same GPA, a single
line is shown for this period. After 1972, a difference appeared:
the transfer students earned a graduation GPA of about 2.75,
while those who took the "designed freshman program earned a
graduation GPA of 2.94, a difference of 0.19 points in favor of
those who had the Guided Design experience. Since the freshman
program accounts for 4 percent of each student's total credits, a
small portion of the gain can be attributed to this
competencybased program, while the rest is earned in the other
classes.
If the minimum GPA required for graduation (2.0) is used as a base, then the 2.94 earned by those students who took the freshman program is almost 25 percent higher than the 2.75 earned by students who did not. This difference has persisted since 1972; those who take the required twocourse Guided Design sequence earn better grades during their college careers than those who transfer to the college. Given these data, one might speculate that a lower quality of transfer student now comes to the University, but there is no reason to assume such a change has occurred. A general grade inflation might also be suggested, but this is not the case. In fact, the lower curve on figure 4, which represents transfer student grades, lies parallel to the curve for all students at the University. Of course, these differences may be due to factors yet to be identified, but at this point the data seem to show that since the introduction of the freshman program, fewer students drop out, and those who stay earn better grades during their years in college.
Another test that can be applied to these data is to determine if other comparable engineering colleges have experienced similar trends. A response from a typical, large statesupported school showed:
1) ACT scores were equivalent to those shown in figure 1, with engineering students above other students.
2) Freshman grades for engineering matched the average GPA for all other freshmen, i.e., there was no difference nor shift like that shown in figure 2.
3) A completion rate of about 40 percent was constant over the period considered here. The grade inflation that did occur at this school apparently had no effect on the completion rate shown in figure 3.
4) A GPA curve for engineering graduates matched the lower curve shown on figure 4.
Given all these data, it is difficult to avoid the conclusion that a unique change in student performance has occurred at WVU as a result of faculty concern and the introduction of a new, competencybased freshman program focused on teaching the skills of both singleanswer problem solving and decision making. These results concur with educational research, which suggests that a focus on intellectual skills and motivation should produce improved student performance. These data also suggest that before one takes umbrage with the concept of competencybased testing, one should consider what happens to students during subsequent years in college.
Whatever is the "real" explanation for these data, all engineering faculty at WVU can take pride in the success of their students and the improved productivity of their college. Both changes have occurred in the absence of improved facilities, or increases in personnel or budget, which means the faculty and staff can take a good share of the credit. If an industrial facility did as well, the operating engineers would be rewarded by promotions, raises, and bonuses. Perhaps that should happen to engineering faculty, too.
I would like to thank Gene D'Amour, Philosophy Department, WVU, for his assistance on the development of this paper and the Exxon Education Foundation, which has supported both the development and propagation of Guided Design.
Charles E. Wales is professor of engineering and education, director of freshman engineering, and codirector of the University Faculty Development Teaching Program at West Virginia University. His work as an "educational engineer" resulted in the development of the Guided Design teachinglearning strategy.
*Sixtyseven different engineering faculty, from full professors to graduate students, have taught in the freshman program.